
Risk Aversion Gone Missing
Investors have increasingly allowed the degree of “risk aversion” to fade from their portfolios.

Sometimes in the stock market, investors coalesce around a common theme or simultaneously avoid an important part. Often, such “herding” behavior provides important information which should not be ignored – nor necessarily followed. This may be one of those times.
Throughout much of this bull market, the investment “herd” has piled into new era stocks with great success. This bull run has constantly been comforted by several celebrity sightings including the Mag7, Quantum Computing, Hyperscalers, Artificial Intelligence, Microcaps, IPOs, and Crypto. Among all the excitement, perhaps understandably, investors have increasingly allowed the degree of “risk aversion” to fade from their portfolios.
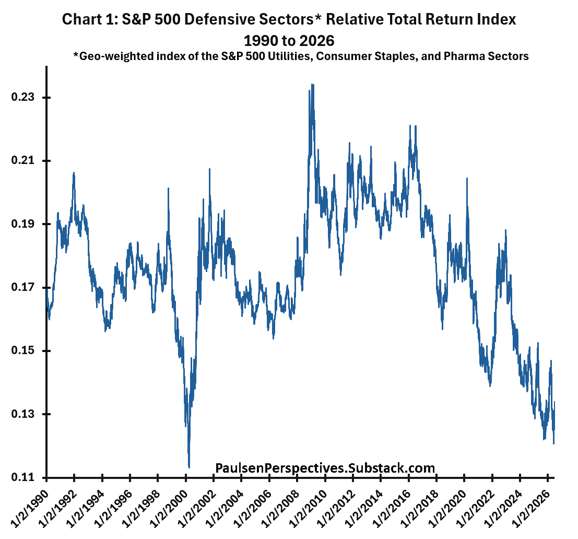
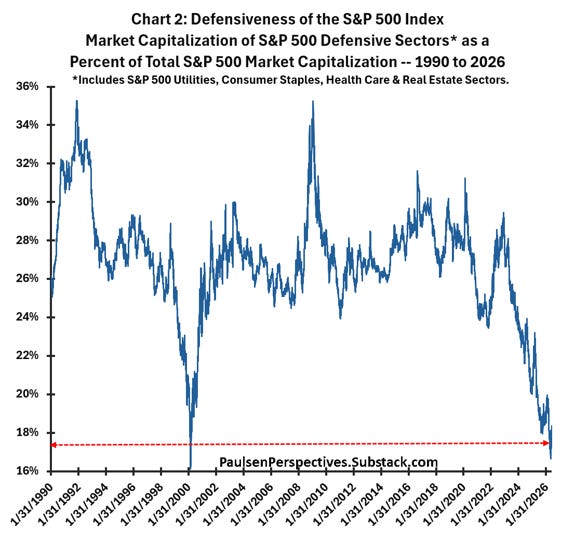
Chart 1 illustrates that “defensive stocks” have been a chronic underperformer during the contemporary bull market and have persistently underperformed during much of the last decade. And chart 2 demonstrates that risk aversion within the S&P 500 index has slowly gone missing. The current market capitalization comprised by defensive stocks within the S&P 500 index has declined to about 17% of total S&P 500 market capitalization. This is close to a record low and is nearly one-half less than its peak representation during the early-1990s and again at the 2009 stock market low when defense comprised almost 36% of the overall stock market. Who knows how long the “current” tech craze will last or how much further the stock market will surge higher led by new era stocks? Nobody!
Nonetheless, what is becoming clear is the S&P 500 index – and probably most portfolios -- are becoming much riskier. With “defense” now comprising such a small share of capitalization, expect wilder market swings during the balance of this bull market. Running only on octane without defensive buffers could still prove successful but probably much more nerve-wracking. Moreover, with risk aversion increasingly awol, the chance of disappointing results has increased.
Stock Market Risk Aversion
One of the better measures of risk aversion within the stock market may be the relative performance of low beta stocks compared to high beta stocks. Chart 3 illustrates the total return performance of the lowest quintile price beta stocks relative to the performance of the highest quintile price beta stocks since 1963. The data comes from the Kenneth R. French database and includes all U.S. stocks listed on the NYSE, Nasdaq, and Amex exchanges.
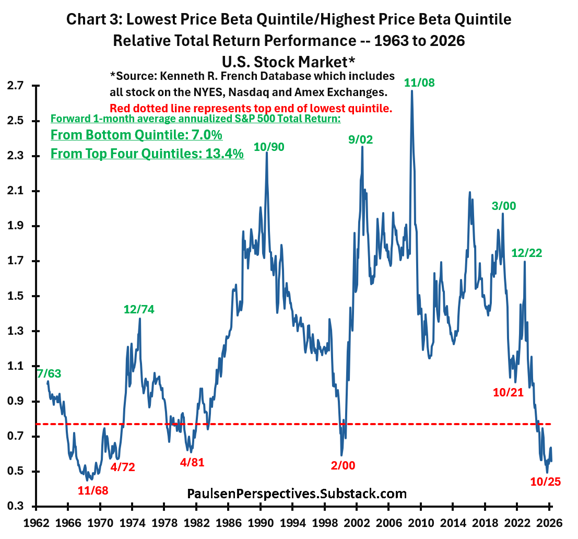
The performance spread between the most defensive stocks and most aggressive stocks has been wide during the last almost 65 years. The relative total return index between low and high beta stocks has ranged from about 0.4 to 2.7. Periods of extreme defensiveness among investors is shown by the highest relative values and extreme bullishness (or a lack of defensiveness) is demonstrated by the lowest relative readings.
The dates shown on this chart make clear that the degree of defensiveness is closely related to future risk in the overall stock market. The major peaks in the relative performance of low vs. high beta stocks (those shown in green) – which are often characterized by excessive pessimism and caution driving the outperformance of the most defensive stocks -- usually represent very good buying opportunities. For example, buying the stock market in July 1963 was immediately after the Cuban Missile Crisis selloff and from July 1963 to the S&P 500 peak in 1968, the stock market rose by almost 60%! December 1974 marked the Nifty-Fifty low in the stock market, October 1990 represented the “start” of the 1990s colossal bull market, September 2002 designated the dot.com bear market low, November 2008 was just a few months before the Great Recession Bear market in early-March 2009, March 2000 was the Pandemic bear market low, and finally, December 2022 was very close to the 2022 bear market low.
Major lows in this relative total return index – when low beta stocks significantly underperform high beta for a period generally signify wide-spread optimism and very low defensiveness within the stock market (shown by the red dates in chart 3) -- have historically proved to be times when investors should be cautious when investing in the stock market. November 1968 was the start of the 1969-70 bear market, April 1972 was a few months before the start of the Nifty-Fifty stock market collapse, April 1981 marked the beginning of the Post-Volcker Tightening bear market, February 2000 nearly top-ticked the dot.com bull market, and October 2021 was within weeks of the start of the 2022 bear market.
Last October, this defensiveness indicator approached its lowest level since 1963. Although the S&P 500 Index did suffer an almost 10% correction earlier this year – bottoming in March – it has since rallied to new record highs. Nonetheless, the low/high beta relative performance across the U.S. stock market remains severely depressed and is still signaling potential difficulty for the overall stock market in the coming months.
The red dotted line represents the lowest quintile of this indicator since 1963. As recorded on the chart, the forward 1-month average annualized total return of the S&P 500 index has only been 7% (a below average return) when the low/high beta relative index has been lowest quintile compared to an average forward average annualized return of 13.4% the rest of the time. That is, historically, when defensiveness is lowest quintile, the S&P 500’s forward 1-month average annualized total return is roughly “one-half” lower than what the stock market provides the rest of the time. When defensiveness goes missing, “caution” is best advised for investors.
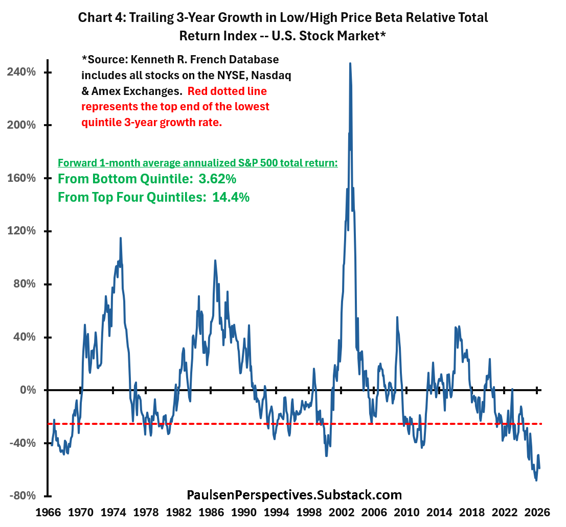
This point is demonstrated more clearly in chart 4 which shows the trailing 3-year growth in the low/high price beta relative total return index (i.e., the trailing 3-year growth of the series shown in chart 3). Although the level of the low/high beta relative performance matters for future stock market returns, the degree of persistent underperformance also matters. Today, not only is the relative total return of low/high beta stocks near a record low, but low beta stocks have been underperforming significantly for at least the last 3 years. As demonstrated on chart 4, historically, whenever the trailing 3-year relative total return of low/high beta stocks has been in its lowest quintile since 1963 (i.e., below the red dotted line suggesting severe and persistent relative underperformance by low beta stocks as it is currently), the future 1-month average annualized S&P 500 total return has been a very disappointing 3.62% compared to a 14.4% average annualized total return the rest of the time. Having low beta stocks underperform but as much as they have in recent years for a long period of time – suggest investors have thrown caution to the wind – implies the S&P 500 may face a tough road in the coming months. Historically, the total forward 1-month average annualized S&P 500 return has been almost 4 times less when this caution signal is flashing red as it is today compared to the rest of the time since 1963.
Consider Overweighting Broad Market Plays
While downside turbulence in the overall stock market will likely impact all stocks, I suspect any selloff will be concentrated among the highly popular (high beta) New Era stock sectors. Consequently, adjusting the portfolio to an underweight among these over-owned sectors and augmenting broader market plays like small caps, value stocks, defensive and cyclical sectors, and international stocks, may outpace the overall S&P 500 during the balance of this year.
Chart 5 shows the relative total return index of a proxy for the “Broad Stock Market” since 1950. A few points are noteworthy. First, the broader stock market has been mostly underperforming the overall S&P 500 Index since about 2011 – similar to its persistent underperformance between 1983 to the late-1990s. Indeed, since 2011, the relative total return of broad market plays has declined from its highest quintile to its lowest quintile. Using its relative total return index as an attractiveness guide, it has gone from massively over-owned and too popular in 2011 to extremely under-owned and cheap today.
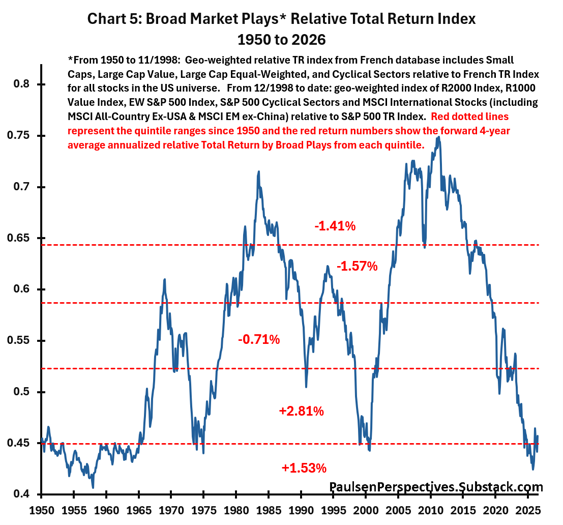
Second, historically, the relative performance of broad market plays has tended to experience “prolonged” cycles. It outpaced substantially between about 1958 to 1969, underperformed between 1969 to 1975, again persistently led the stock market for almost a decade from 1975 to almost 1984, suffered nearly a 15-year period of underperformance from 1985 until 2000, outpaced again for a decade until 2010, and has mostly underperformed during the last 15 years. Long persistent relative performance cycles are not at all uncommon. Importantly, if the relative performance low reached last October holds, this underperformance cycle among broad market stocks will represent one of the longest periods of persistent underperformance during the post-war era. The recent era of broad market underperformance has been long and significant, and most importantly, appears overdue for a turnaround.
Third, since October 2025, broad market plays have again been outperforming the overall stock market for the “first time” during the contemporary bull market. It’s interesting that while most are still focused on how much AI and other “tech names” are still leading the stock market, quietly “broad market plays” have been outperforming by one of their largest amounts of the last 15 years.
Finally, as shown on chart 5, since 1950, the average annualized 1-month forward outperformance above the overall S&P 500 Index of broad market plays has been 1.53% to 2.81% when the relative broad market total return index resides in its lowest two quintiles (as it is today). If broad market plays have finally turned a corner, they could continue outpacing the overall S&P 500 for some time.
Final Comments
I am concerned that “defensiveness” in the U.S. stock market has seemingly gone awol. Most investors are still more worried about “missing out” on the next leg of this New Era bull run – now supposedly led by AI stocks—then they are about suffering any major stock market setback.
A temporary “gut check” for investors may be nearing, led but not necessarily limited only to New Era stocks. My guess is a bear market will be avoided even if New Era stocks do correct more than 20%. I am not suggesting investors should sell all their tech stocks. I do not expect the potential coming turbulence to replicate the dotcom collapse. But I would tilt the overall portfolio to an underweighted position in New Era stocks and boost exposure to an overweight among “broad market plays”. With broad market plays already outperforming since last October, even if New Era stocks and the overall stock market continue rising in the coming months, perhaps lightening up on New Era stocks may still prove beneficial to your overall relative performance.
Thanks for Taking a Peek! Jimp
Disclosures________________________________________________________________
Please note that stocks are inherently risky. Any stock can lose most of its value at any moment, including any stock I mention here. You should never rely on a single source for investment decisions, including me. I am a retired investment strategist offering opinions and observations on the markets, the economy and companies. You should do your own research and also consult a qualified financial planner and investment advisor before making investment decisions.
This communication has been prepared for your informational purposes only. This material is for illustration and discussion purposes only and are not intended to be, nor should they be construed as financial, legal, tax or investment advice. This material presents information through the date indicated, is only a guide to the author’s current expectations and is subject to revision by the author, though the author is under no obligation to do so. The views expressed herein are solely those of the author. This material should not be construed as a recommendation, or advice or an offer or solicitation with respect to the purchase or sale of any investment. The information in this report is not intended to provide a basis on which you could make an investment decision on any particular security or its issuer.
Certain information has been provided by and/or is based on third party sources and, although such information is believed to be reliable, no representation is made is made with respect to the accuracy, completeness or timeliness of such information. This information may be subject to change without notice. I make no obligation to maintain or update this material based on subsequent information and events or to provide you with any additional or supplemental information or any update to or correction of the information contained herein. Any opinions and assumptions expressed herein are made as of the date of this communication and are subject to change and/or withdrawal without notice. No liability is accepted by the author for any losses that may arise from any use of the information contained herein.
Any financial instruments mentioned herein are speculative in nature and may involve risk to principal and interest. Any prices or levels shown are either historical or purely indicative. This material does not take into account the particular investment objectives or financial circumstances, objectives or needs of any specific investor, and are not intended as recommendations of particular securities, investment products, or other financial products or strategies to particular clients. Securities, investment products, other financial products or strategies discussed herein may not be suitable for all investors. The recipient of this report must make its own independent decisions regarding any securities, investment products or other financial products.