
FOMO with NBO?
The recent unique price action of the S&P 500 Low Volatility Index, in my view, suggests investors have simultaneously become worried about both missing out (FOMO) and of not being out (NBO).

Recently, the performance of the S&P 500 Low Volatility Stock Price Index has been unprecedented. Normally, low volatility stocks rise less when the S&P 500 increases and fall less when the S&P 500 decreases. During the last six months, however, the price of low volatility investments on average has risen during days when the S&P 500 has decreased and fallen on days when the S&P 500 has increased. That is, daily declines in the S&P 500 have not simply been causing defensive low vol stocks to outperform by falling less but by have actually boosted the price of low vol stocks despite S&P 500 price declines. Alternatively, on days when the S&P 500 has risen, on average the price of low vol stocks has not simply underperformed but has actually declined. This recent unprecedented and extreme price action displayed by the S&P 500 Low Volatility Index in my view suggests investors have simultaneously become worried about both missing out (FOMO) and of not being out (NBO). Historically, this type of low volatility stock price action has proved a cautionary sign for both the stock market and for technology stocks.
The S&P 500 Low Volatility Index is designed to measure the performance of the 100 least volatile stocks in the S&P 500 Index. The index is comprised by everything defensive – an array of securities including high quality, stable earners, secure dividend paying, and low-price beta. It’s the stereotypical buy of the fearful and what is quickly sold when bullish. This index is specifically built to rise less in bull markets while declining less in bear markets aimed at satisfying conservative investors who wish to participate but fears NBO.
But what does it mean when low vol investments rise as the market falls and fall when the market rises? In my view, this portrays a market driven not by excessive bullishness nor excessive bearishness, but rather by investors who are simultaneously worried by both FOMO and NBO. Excessive bullishness causes low vol stocks to underperform and excessive bearishness makes low vol stocks winners. But when the joint fears of FOMO and NBO are both prominent, low vol stocks perversely “rise” during down days and “fall” during up days. With FOMO & NBO, up market days are met not just by buying octane but by also selling low vol and falling market days simultaneously encourage octane sales and stimulate low vol buying!
Performance of S&P Low Vol Index During UP & Down S&P 500 Days
Chart 1 shows the average daily percent price gains in the S&P 500 low vol index over rolling 6-month periods since 1990 for all days when the S&P 500 rises (blue line) compared to all days when the S&P 500 falls (red line). As demonstrated, the average S&P 500 low vol percent price change over almost all rolling six-month periods has been positive when the overall S&P 500 index rises and has been negative when the S&P 500 index falls.
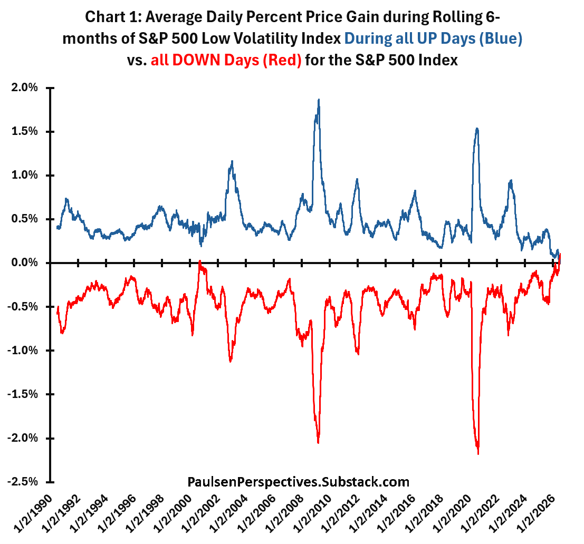
Outside of the current situation, only once briefly in 2000 was the average rolling six-month low volatility index price percent change “positive” during daily S&P 500 advances and it was never “negative” during daily S&P 500 declines. Although the low vol index has almost always underperformed during rising S&P 500 markets and outperformed during falling S&P 500 markets, except for the contemporary period, it hasn’t had its previous six-month performance rise for all days when the S&P 500 declined and fall for all days when the S&P 500 advanced. That is, during the last six months, the performance of the S&P 500 Low Vol index has been “unique” compared to any other time since 1990 – it has risen on average during all S&P 500 down days (red line) during the last 6 months and simultaneously on average has fallen during all S&P 500 up days (blue line) during the last 6 months! This possibly reflects a landmark or at least very uncommon investor mindset or emotion driving the stock market – which my guess is a FOMO/NBO combo!
Low Vol UP less DOWN Days Average Historical Performance
Chart 2 illustrates this unique change in the performance of the S&P 500 Low Vol index from a slightly different perspective. It shows the trailing 26-week average performance differential of the Low Vol index for all weeks when the S&P 500 rose compared to all weeks when the S&P 500 declined. That is, the difference between the red line and blue line in chart 1. As demonstrated, during the contemporary period, this differential has been “uniquely” negative (i.e., low vol gains have been less during overall S&P 500 advances than they have when the S&P 500 has declined).
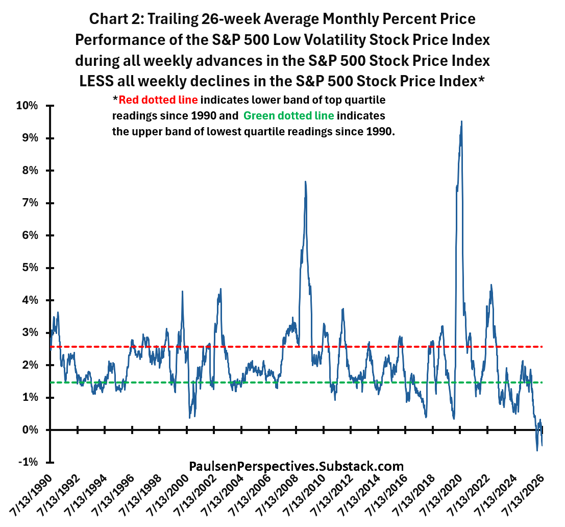
While this performance differential has never been negative as it is today, it has often dipped into its lowest historical quartile (i.e., below the green dotted line) when near to several notable stock market peaks – e.g., in mid-2000, in 2007, in 2018, in early-2020, and in late-2021. It also frequently spiked into its upper quartile (above the red dotted line) near several notable stock market bottoms – e.g., in early-1991, late-2002, March 2009, mid-2020, and late-2022.
FOMO/NBO & Future S&P 500 Performance
What has the S&P Low Vol performance spread between previous S&P 500 Up less Down days implied about future overall S&P 500 performance? Chart 3 highlights that since 1990, the average annualized forward 1-week S&P 500 percent price gain has proved highly sensitive to the low vol spread differential quartile. When the low vol spread has been in its highest quartile (i.e., above the red dotted line in chart 2), the S&P 500 has delivered a robust future average annualized price gain of 17.26%. It’s average annualized future 1-week gain declines to 10.12% when the low vol differential was in its middle two quartiles, and finally, the S&P 500 future 1-week average annualized price gain declines to a very disappointing 3.92% for all weeks when the low vol differential was in its lowest quartile.
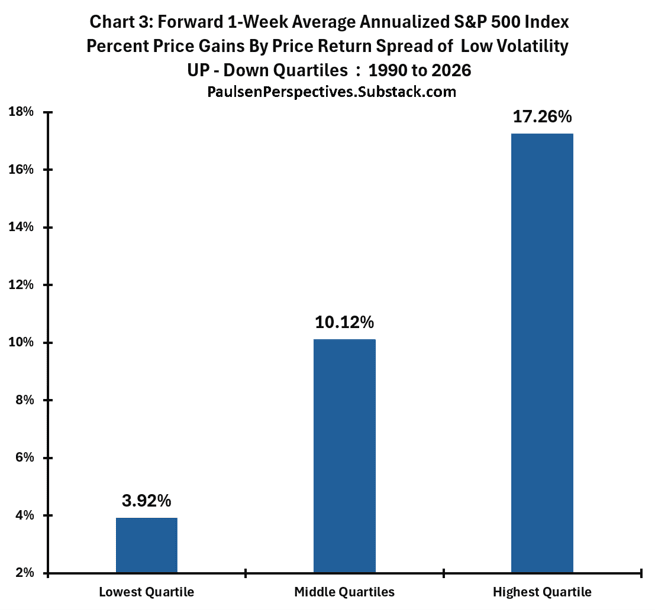
Obviously, the spread in the performance of the low vol index during rising and falling overall stock markets has historically been important for the upcoming performance of the S&P 500 index. Essentially, as long as low vol results do much better in up markets than in down markets, the overall S&P 500 usually delivers solid results. However, when low vol investing delivers better results on down market days relative to up market days, the future performance of the overall S&P 500 usually struggles.
Overall, I believe this indicator represents a proxy for investor mindsets. The performance of low vol investments demonstrate how much attention investors are devoting to risk aversion. When low vol investments start doing much better in down markets than in up markets compared to norms, it signals investors are placing more value capital preservation – i.e., their greatest fear is of NBO. And, in the unique position we are in today – where up day low vol price performance has been negative because FOMO is causing investors to dump low vol stocks for more aggressive alternatives while simultaneously down day low vol price performance has been positive because falling markets are really scaring investors about NBO – implies an almost schizophrenic anxious mindset is driving the stock market.
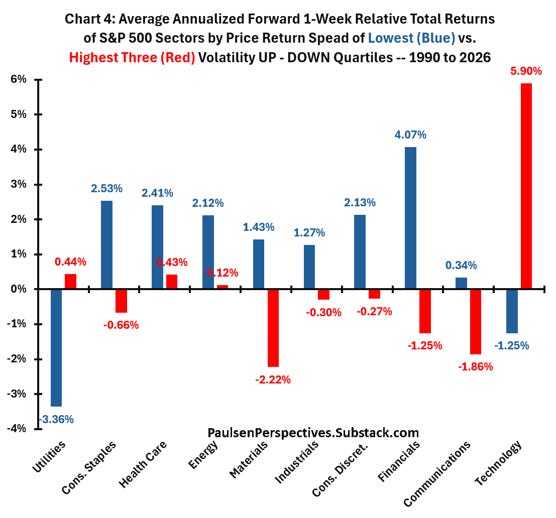
Finally, chart 4 shows how the major 10 sectors of the S&P 500 have performed since 1990 (the real estate sector was not considered because of its short history) when the low vol performance spread has been in its lowest quartile (blue bars) compared to how they have performance when the low vol spread has been in its highest three quartiles (red bars). Outside of the utilities sector, lowest quartile results have been particularly supportive of S&P 500 old era sectors whereas new era sectors (i.e., technology and communications services) have typically performed much better when the low vol performance spread has been in its upper three quartiles. Consequently, should the low vol spread remains bottom quartile, based on history, not only should investors expect subpar S&P 500 results, but investors should also consider boosting old era sector exposures and be more cautious about over weights in Technology and Communications Services.
Final Comments
For the first time in this bull market, there is some hair on the new era trade. While the technology/communications sectors are still leading the stock market and have recently enjoyed a big boost from the AI story, stock market volatility has increased – evidenced by the spring 2025 almost 20% drop and the first quarter 2026 almost 10% decline in the S&P 500 index. Although earnings results – particularly among new era companies – remain spectacular, S&P 500 technology stocks and the Mag 7 index have now been little more than market performers since mid-2024. Moreover, for the first time in this bull market, during the last year, “broader market plays” like small caps, value stocks, and international stocks have performed much more comparably with new era stocks. Investor sentiment measures suggest investors are neither excessively enthusiastic nor massively pessimistic. The CNN Fear & Greed Index is slightly below average, and the AAII sentiment index is slightly above average.
Nobody wants to miss out if AI is taking over the world (FOMO?), but many are also getting increasingly uneasy about high valuations, concentrated ownership, and wildly aggressive future expectations for earnings (NBO?). The result? The low vol performance spread between up- and down-market days is negative for the first time ever reflecting a stock market which increasingly seems to be simultaneously and perhaps schizophrenically driven by both FOMO & NBO! This suggests investors may want to proceed with caution in the coming months.
Thanks for Taking a Peek! Jimp
Disclosures________________________________________________________________
Please note that stocks are inherently risky. Any stock can lose most of its value at any moment, including any stock I mention here. You should never rely on a single source for investment decisions, including me. I am a retired investment strategist offering opinions and observations on the markets, the economy and companies. You should do your own research and also consult a qualified financial planner and investment advisor before making investment decisions.
This communication has been prepared for your informational purposes only. This material is for illustration and discussion purposes only and are not intended to be, nor should they be construed as financial, legal, tax or investment advice. This material presents information through the date indicated, is only a guide to the author’s current expectations and is subject to revision by the author, though the author is under no obligation to do so. The views expressed herein are solely those of the author. This material should not be construed as a recommendation, or advice or an offer or solicitation with respect to the purchase or sale of any investment. The information in this report is not intended to provide a basis on which you could make an investment decision on any particular security or its issuer.
Certain information has been provided by and/or is based on third party sources and, although such information is believed to be reliable, no representation is made is made with respect to the accuracy, completeness or timeliness of such information. This information may be subject to change without notice. I make no obligation to maintain or update this material based on subsequent information and events or to provide you with any additional or supplemental information or any update to or correction of the information contained herein. Any opinions and assumptions expressed herein are made as of the date of this communication and are subject to change and/or withdrawal without notice. No liability is accepted by the author for any losses that may arise from any use of the information contained herein.
Any financial instruments mentioned herein are speculative in nature and may involve risk to principal and interest. Any prices or levels shown are either historical or purely indicative. This material does not take into account the particular investment objectives or financial circumstances, objectives or needs of any specific investor, and are not intended as recommendations of particular securities, investment products, or other financial products or strategies to particular clients. Securities, investment products, other financial products or strategies discussed herein may not be suitable for all investors. The recipient of this report must make its own independent decisions regarding any securities, investment products or other financial products.
Great post, thanks. It would be nice to have the forward 1-week volatility and drawdown alongside the returns. The current regime is late-bull behavior; forward returns are lower, but maybe the median dip is shallow (because of sector & factor rotation instead of indiscriminate selling across the board).