
Calendar Dread
The stock market has does quite well in the dreaded August-October period provided money supply growth is rising and bond yields have been declining.

We are soon entering that part of the calendar which frequently has proved dreadful for the stock market – August, September, and October. And of course, adding to the anxieties, this feared season nears just as the Mag 7 leadership is wavering. Hang onto to your seats because similar to several Autumns past, it could be a bumpy ride.
Charts 1 illustrates the seasonal challenge the coming three months have historically represented for investors. Since 1950, by a wide margin, September has been the worst month for stock returns with an average monthly return of -0.53% — the only month with a negative average monthly return. August is the third worst month delivering only a 0.42% return. While October looks favorable – it has the seventh best monthly average return at 1.08% -- this month boasts some of the worst stock market collapses in U.S. history.
For example, the Great Crash of 1929 is mostly associated with October 24 called Black Thursday, the day of the largest sell-off of shares in U.S. history, and October 29 called Black Tuesday, when investors traded some 16 million shares on the New York Stock Exchange in a single day. And of course, the 1929 October crash signaled the beginning of the Great Depression. Another October day, Black Monday October 19, 1987, will also live in infamy as the biggest single day decline in stock market history. The reason the average October return is still more than 1%, despite experiencing some of the worst collapses in stock market history, is because October has also been a month when many Bull markets began. Some examples include Bull market beginnings in October 1966, October 1974, October 1990, October 2002, and October 2022. Overall, while October is a mixed bag, at a minimum it tends to be volatile.
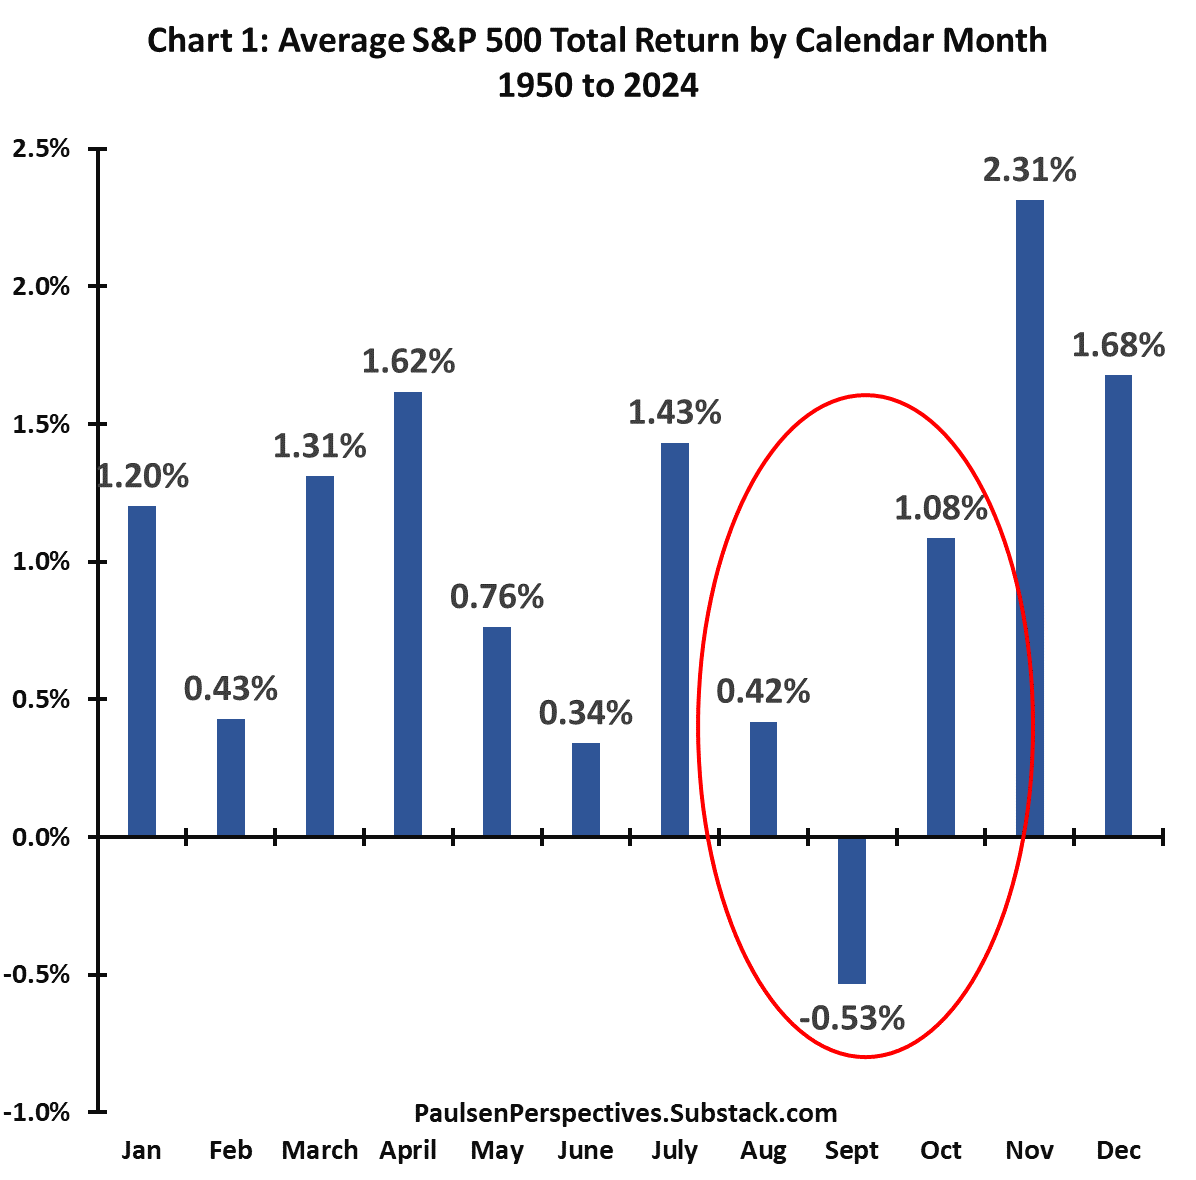
Chart 2 highlights that these Autumn months also have some of the highest frequencies of negative monthly returns. Since 1950, August and September have provided the two highest frequencies of negative total returns, and October is only slightly better at avoiding negative results.
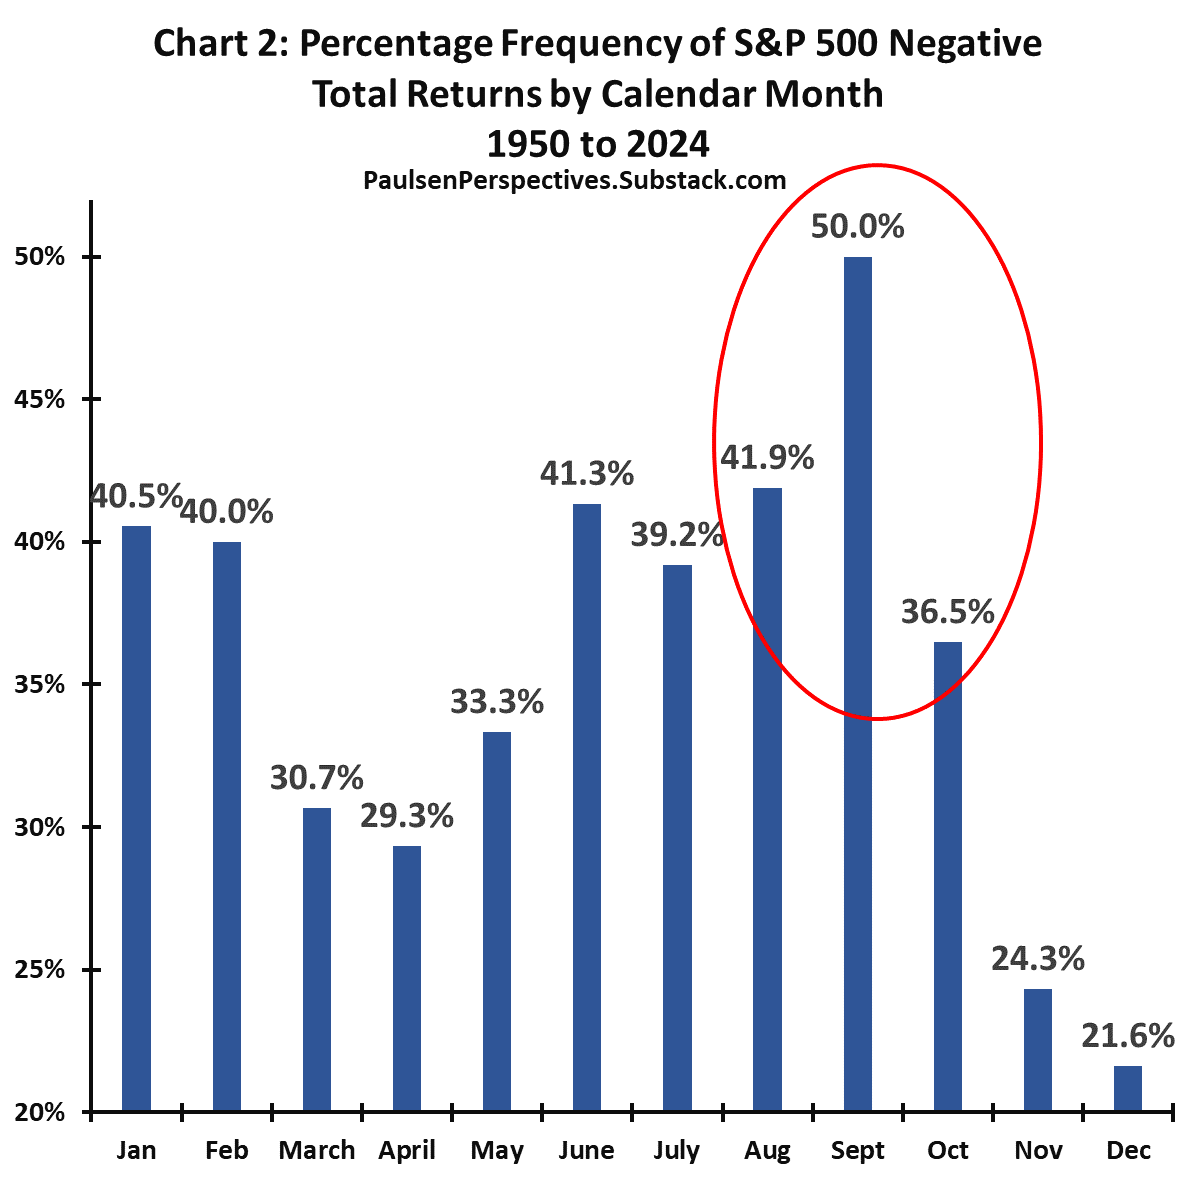
For the entire Fall season, since 1950, during August, September, and October, the S&P 500 average annualized total return has only been 3.92% compared to a 15.8% average annualized return for the other nine months. Fall has historically been a tough season for stock investors.
